Calculate the anion gap, albumin-corrected gap, and delta ratios from electrolyte and albumin results.
Laboratory values
Enter values from the same blood sample
Anion gap
Acid–base calculation
Calculated gaps and ratios
The calculated values will appear here
Copy sodium, chloride, bicarbonate, and albumin from the same laboratory panel.
Albumin-corrected anion gapcorrected AG = Na − (Cl + HCO₃) + 2.5 × (4 − albumin g/dL)
Uncorrected anion gap
0 mEq/L
Corrected anion gap
0 mEq/L
Delta gap
0 mEq/L
Delta ratio
—
Corrected delta gap
0 mEq/L
Corrected delta ratio
—
Pattern note
—
Educational estimate only—not medical advice, a diagnosis, or a treatment instruction. Laboratory reference ranges and albumin-correction practices vary. Delta ratios are meaningful only in the appropriate acid–base context.
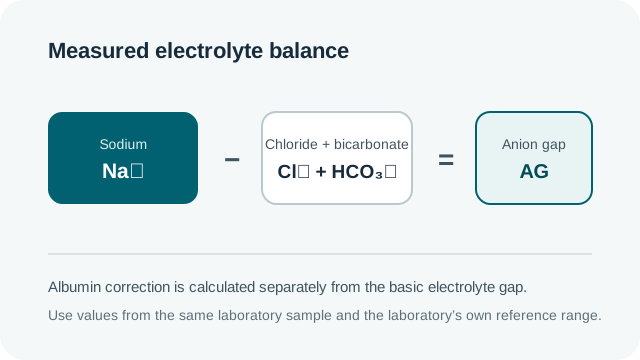
The basic gap subtracts measured chloride and bicarbonate from sodium; albumin correction is shown separately.
What is Serum Anion Gap?
The serum anion gap is a calculated difference between commonly measured ions. Clinicians use it as one part of evaluating acid–base disorders, particularly metabolic acidosis. This page calculates an uncorrected gap, an albumin-corrected gap, delta gaps and delta ratios from sodium, chloride, bicarbonate and albumin.
The result is not a diagnosis and cannot safely be interpreted without symptoms, blood pH, carbon dioxide, kidney function, medications, laboratory methods and clinical context. Unexpected or seriously abnormal laboratory results require prompt review by a qualified healthcare professional. Seek urgent care for severe illness, breathing difficulty, confusion, poisoning concerns or another emergency.
How to Use This Calculator
Enter sodium, chloride and bicarbonate from a consistent sample. For these monovalent ions, the numeric values in mmol/L and mEq/L are equivalent.
Enter albumin and choose g/dL or g/L. The page converts g/L to g/dL.
Select Calculate. Review the raw and albumin-corrected gaps before the delta calculations.
Compare only with the reference interval and method used by the reporting laboratory.
This formula omits potassium. Bicarbonate of 24 makes the delta-ratio denominator zero, so the ratio is reported as undefined rather than assigned a clinical category.
Formula Used
AG = sodium − chloride − bicarbonate Corrected AG = AG + 2.5 × (4 − albumin in g/dL) Delta gap = AG − 12 Delta ratio = delta gap ÷ (24 − bicarbonate)
The page also calculates a corrected delta gap and ratio using corrected AG. Constants of 12, 24 and 4 reflect a conventional calculation, not every laboratory’s reference values.
Variables Explained
Input or result
Meaning
Sodium
Measured major extracellular cation concentration.
Chloride
Measured anion concentration included in the subtraction.
Bicarbonate
Measured or reported total-carbon-dioxide-related value used by the laboratory.
Albumin
Major unmeasured anionic protein; low concentration can lower the apparent gap.
AG
Difference between measured sodium and the sum of chloride and bicarbonate.
Corrected AG
Estimate adjusted to albumin of 4 g/dL by the stated formula.
Delta ratio
Change in gap divided by change from bicarbonate 24, when defined.
Worked Example
Use sodium 140 mEq/L, chloride 102 mEq/L, bicarbonate 18 mEq/L and albumin 3.2 g/dL. Raw AG is 140 − 102 − 18 = 20 mEq/L.
Albumin correction adds 2.5 × (4 − 3.2) = 2, producing a corrected AG of 22 mEq/L. Raw delta gap is 20 − 12 = 8 and raw delta ratio is 8 ÷ (24 − 18) = 1.33. The corrected delta gap is 10 and corrected ratio is 1.67.
These calculations organize laboratory information; they do not identify the cause or establish treatment.
Why Use This Calculator?
An increased gap can reflect unmeasured anions, but the threshold depends on the laboratory analyzer and whether potassium is included. Low albumin can conceal an increase, which is why the page provides the stated correction. A low gap can also be clinically relevant and may reflect measurement or protein-related factors.
Delta ratios are intended for assessment after high-gap metabolic acidosis has been established. Fixed category labels are simplifications and should not replace blood-gas assessment or a clinician’s review. The page’s cautious pattern label uses the albumin-corrected delta ratio while also displaying raw and corrected values.
Values from different collection times may not describe one physiologic state. Verify units, sample timing and unexpected results. Treatment decisions and suspected toxic ingestion require urgent professional assessment rather than self-interpretation of this page.
Repeat testing may be appropriate in clinical care because a single gap is a snapshot. Only the treating team can decide whether a trend, confirmatory measurement or additional test is needed.
Common Mistakes
Comparing a potassium-free calculation with a potassium-inclusive reference interval.
Entering albumin in g/L while selecting g/dL.
Ignoring the reporting laboratory’s own method and interval.
Interpreting the gap without confirming metabolic acidosis and clinical context.
Using a delta ratio when bicarbonate is 24 and its denominator is zero.
Combining electrolytes and albumin drawn at different times.
Treating a calculated category as a diagnosis or treatment direction.
Frequently Asked Questions
Does this calculator diagnose metabolic acidosis?
No. It organizes selected laboratory values. Diagnosis requires pH, clinical assessment and other laboratory information.
Why does albumin change the gap?
Albumin is an important unmeasured anion. A low concentration can lower the observed gap and hide an otherwise increased value.
Does the formula include potassium?
No. Use the matching potassium-free laboratory reference interval when interpreting the result.
Why can the delta ratio be undefined?
When bicarbonate equals 24, the denominator 24 minus bicarbonate is zero, and division by zero has no defined result.
Are mmol/L and mEq/L numerically equal here?
For sodium, chloride and bicarbonate, which are monovalent in this context, the numeric concentrations are equivalent.
Can I use results from different blood draws?
That can misrepresent a changing physiologic state. Values from the same relevant sample are preferable.
What should I do with an unexpected result?
Contact a qualified healthcare professional who can verify the measurements and interpret them with symptoms and the broader clinical picture.